The Ultimate Guide to .NET Observability: Traces, Logs, and Metrics
Stop guessing why your .NET app is failing. Learn how to implement true observability using OpenTelemetry and Grafana Cloud to track traces, metrics, and logs.
Picture this scenario. It is a Friday evening. You just deployed a new feature to your ASP.NET Core application, closed your laptop, and grabbed a coffee. Ten minutes later, your phone buzzes. Production is throwing 500 Internal Server Errors for the new checkout process.
You open your log files. You see a massive wall of text. You see that an error occurred, but you have no idea which user triggered it, which database query failed, or how long the request actually took before it crashed. You are officially flying blind.
If you have ever built a web application, you know this pain. Traditional logging is great for telling you that something broke. However, when you are dealing with modern applications, microservices, or even a decently complex monolithic architecture, simply knowing that an error happened is not enough. You need to know exactly how a request traveled through your entire system to fix the root cause.
This is where observability comes in. In this guide, we are going to fix the "flying blind" problem once and for all. We will explore how to implement OpenTelemetry in a modern .NET application and visualize the results using Grafana. By the end of this tutorial, you will have a robust setup that tracks every request, correlates your logs, and gives you complete visibility into your application's behavior.
The Difference Between Monitoring and Observability
Before we write any code, we need to understand what we are actually building. Developers often use the terms monitoring and observability interchangeably. They are related concepts, but they are not the exact same thing.
Monitoring tells you if your system is working. A monitoring tool pings your server and says, "Yes, the server is up and returning 200 OK responses." Or it says, "CPU usage is at 90 percent." Monitoring is fundamentally about tracking the known symptoms of a system.
Observability tells you why your system is not working. It gives you the deep, contextual data required to debug a problem you have never seen before. When CPU spikes to 90 percent, observability tells you exactly which API endpoint and which specific database query caused that spike. It allows you to ask arbitrary questions about your system's performance and behavior without having to deploy new code just to add more logging.
The Three Pillars of Observability
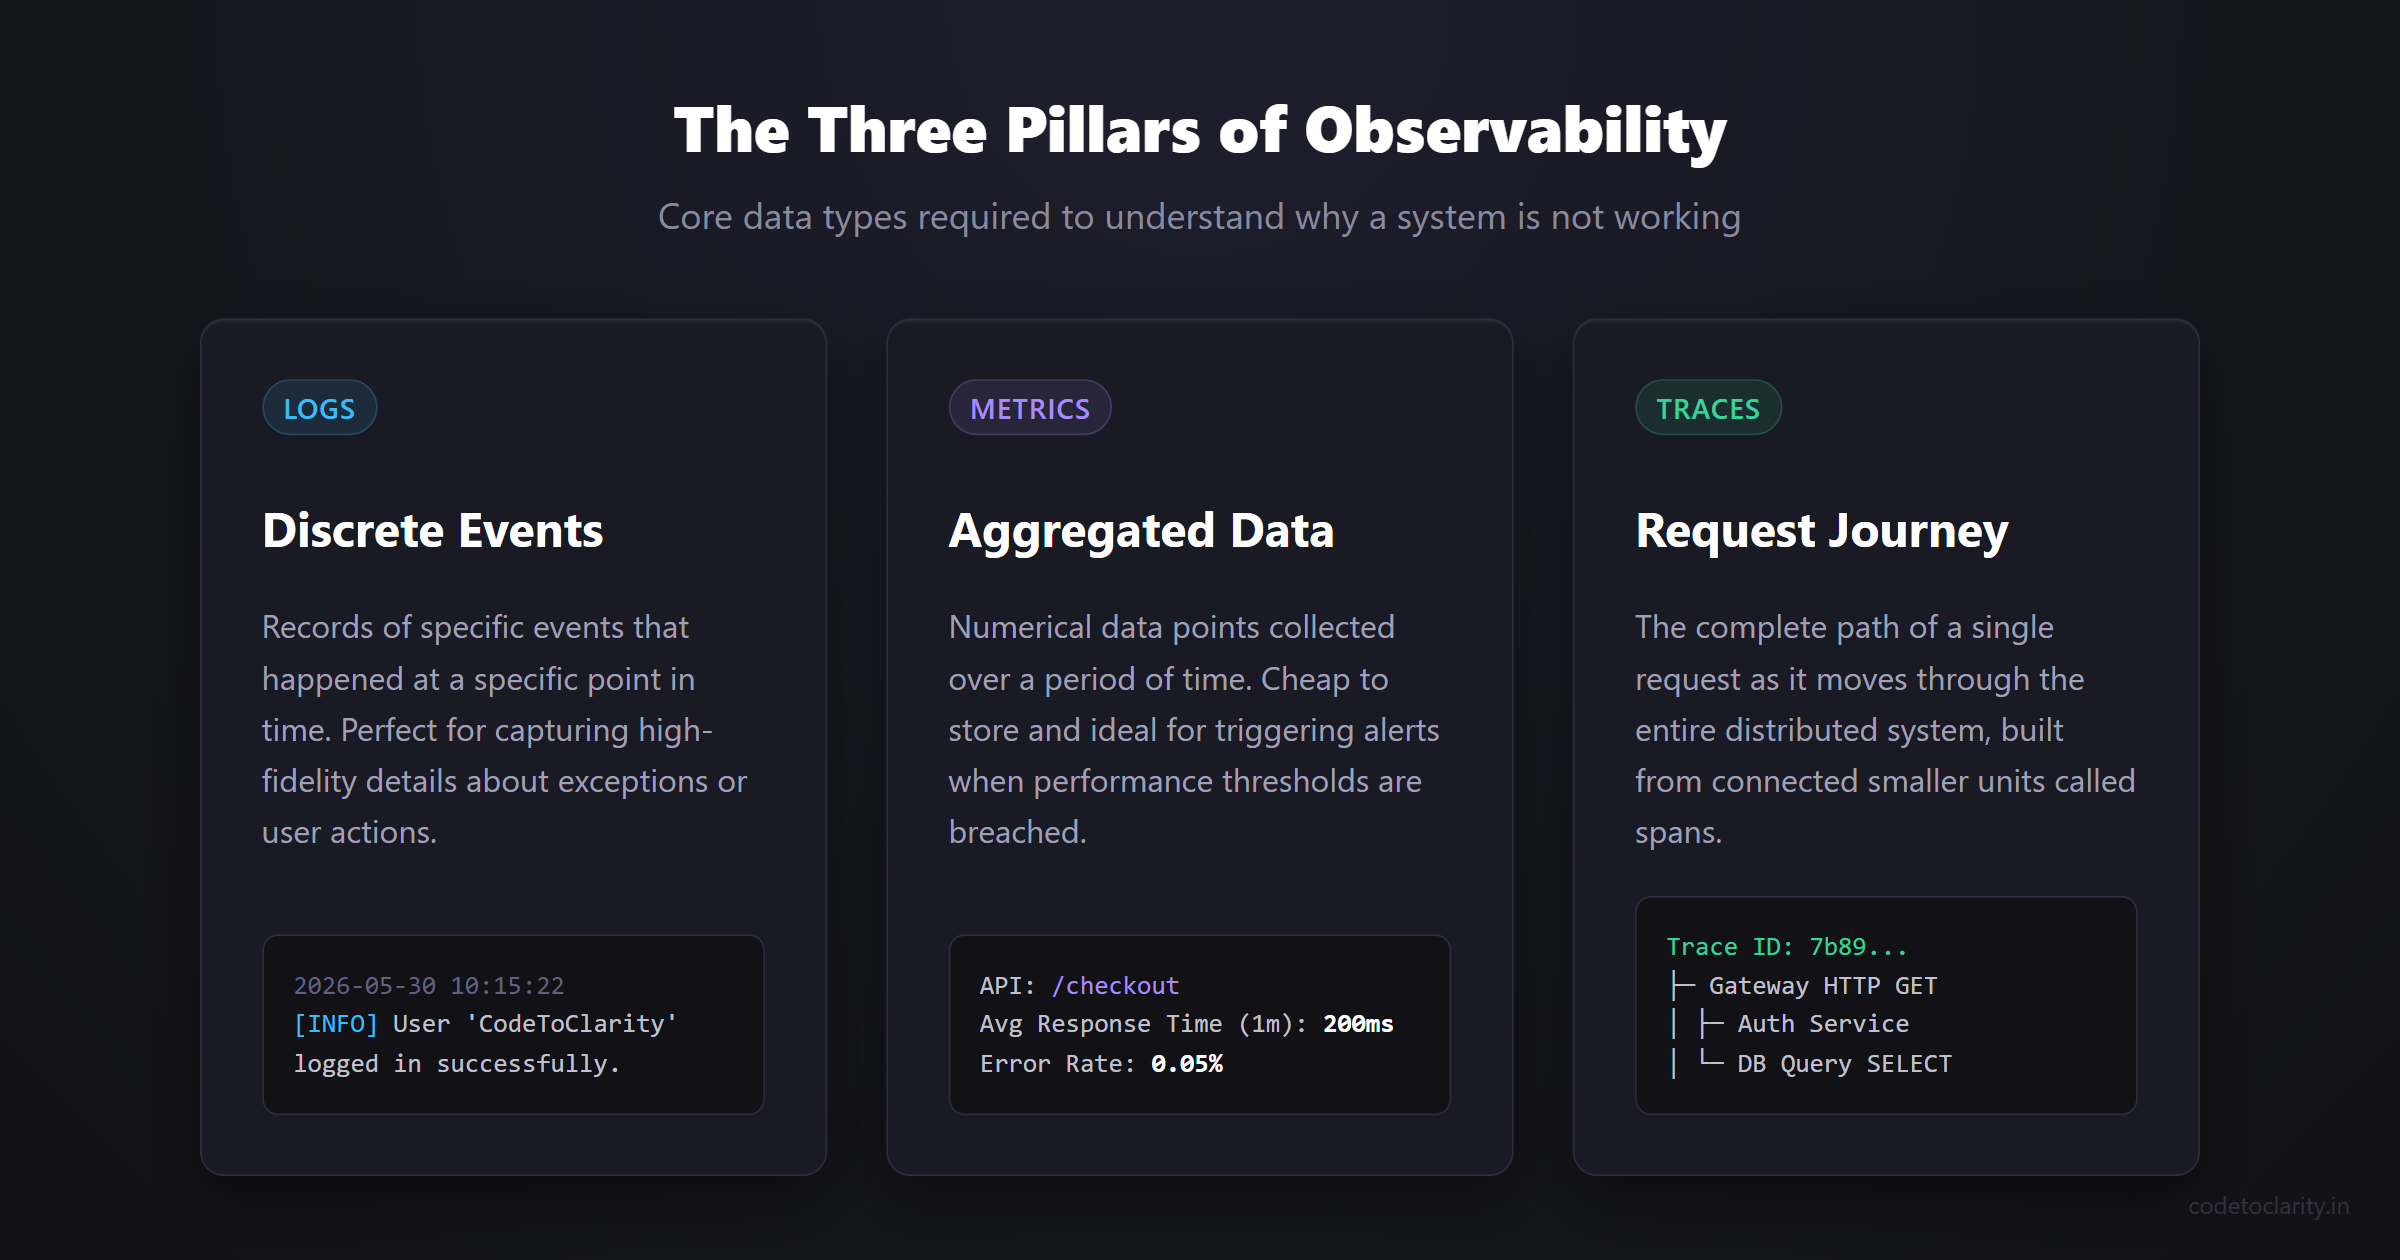
To achieve true observability, we rely on three core types of data. These are commonly referred to as the three pillars of observability.
First, we have Logs. Logs are discrete records of events that happened at a specific point in time. A standard log message might say "User 'CodeToClarity' logged in successfully." Logs are fantastic for capturing high-fidelity details about specific events or exceptions.
Second, we have Metrics. Metrics are numerical data points aggregated over a period of time. Instead of recording every single request, a metric might say "The average response time of the checkout API over the last minute was 200 milliseconds." Metrics are cheap to store and are perfect for triggering alerts when performance thresholds are breached.
Third, we have Traces. Traces represent the complete journey of a single request as it moves through your entire system. A trace shows you that a user clicked a button on the frontend, which hit an API gateway, which called a backend service, which finally executed a database query.
Understanding Traces, Spans, and Context Propagation
For beginners, tracing is usually the most confusing pillar to grasp. Let us break it down further into digestible concepts.
A single trace is made up of smaller units of work called Spans. Think of a trace as a large tree, and spans as the individual branches of that tree. The initial HTTP request into your application is the root span. If that request makes a database call, that database call becomes a child span. Each span records its own start time, end time, and contextual metadata.
To tie all these independent spans together into a single cohesive trace, the observability system uses Context Propagation. When a request enters your system, it is assigned a unique Trace ID. As your application makes calls to other services or databases, it passes this Trace ID along in the HTTP headers or message payloads. Every subsequent system reads this ID and attaches it to their own spans. This mechanism is what allows tools like Grafana to stitch together a complete picture of a complex distributed transaction.
Enter OpenTelemetry and Grafana
Historically, achieving this level of deep observability was an absolute nightmare. Every monitoring vendor had their own proprietary SDK. If you spent weeks instrumenting your application with Vendor A and then decided to switch to Vendor B, you had to completely rewrite all your instrumentation code from scratch.
OpenTelemetry solves this vendor lock-in problem entirely. Often abbreviated as OTel, OpenTelemetry is an open-source observability framework developed by the Cloud Native Computing Foundation. It provides a single, vendor-neutral standard for generating and collecting logs, metrics, and traces. You instrument your .NET code once using the OpenTelemetry SDK. After that, you can send your telemetry data to any backend provider you choose without changing a single line of your application code. You can learn more about the underlying architecture on the OpenTelemetry project website.
For our visualization backend, we are going to use Grafana. Grafana is a highly popular open-source visualization and analytics platform. While you can host it yourself on your own servers, Grafana Cloud offers a fantastic managed service with a generous free tier for developers. Grafana will securely ingest the OpenTelemetry data we send it and provide us with incredibly detailed dashboards to analyze our traces and logs.
Setting Up the .NET Application
Let us get our hands dirty with some practical C# code. Microsoft has fully embraced OpenTelemetry as the standard for diagnostics in .NET, making this integration incredibly smooth. You can read the detailed official Microsoft documentation on OpenTelemetry if you want to dive deeper into the low-level diagnostic APIs.
We will start by creating a new ASP.NET Core Web API project. Open your terminal and run the following command:
dotnet new webapi -n CodeToClarity.ObservabilityDemo
Once the project is created, navigate to the new project directory. We need to add the OpenTelemetry NuGet packages. Run the following commands in your terminal:
dotnet add package OpenTelemetry.Extensions.Hosting
dotnet add package OpenTelemetry.Exporter.OpenTelemetryProtocol
dotnet add package OpenTelemetry.Instrumentation.AspNetCore
dotnet add package OpenTelemetry.Instrumentation.Http
Let us break down exactly what each of these packages does for our application.
The OpenTelemetry.Extensions.Hosting package provides the necessary extension methods to register OpenTelemetry with the standard .NET dependency injection container.
The OpenTelemetry.Exporter.OpenTelemetryProtocol package is often called the OTLP exporter. It is responsible for taking the telemetry data gathered in memory by your application and transmitting it over the network to a backend system like Grafana.
The instrumentation packages are where the automatic magic happens. OpenTelemetry.Instrumentation.AspNetCore automatically tracks all incoming HTTP requests to your API. It silently records the URL path, the HTTP method, the response status code, and the total duration of the request. Similarly, OpenTelemetry.Instrumentation.Http automatically tracks any outgoing HTTP requests made by your application when using the standard HttpClient class.
Wiring Up OpenTelemetry in Program.cs
Now that we have our core packages installed, we need to configure them. Open your Program.cs file. We are going to add the OpenTelemetry configuration directly after creating the web application builder.
using OpenTelemetry.Logs;
using OpenTelemetry.Metrics;
using OpenTelemetry.Resources;
using OpenTelemetry.Trace;

var builder = WebApplication.CreateBuilder(args);

// 1. Define a resource builder to identify our application
var codetoclarityResource = ResourceBuilder.CreateDefault()
    .AddService("CodeToClarity.ObservabilityDemo");

// 2. Configure OpenTelemetry Tracing and Metrics
builder.Services.AddOpenTelemetry()
    .WithTracing(tracing =>
    {
        tracing
            .SetResourceBuilder(codetoclarityResource)
            .AddAspNetCoreInstrumentation()
            .AddHttpClientInstrumentation()
            .AddOtlpExporter();
    })
    .WithMetrics(metrics =>
    {
        metrics
            .SetResourceBuilder(codetoclarityResource)
            .AddAspNetCoreInstrumentation()
            .AddHttpClientInstrumentation()
            .AddOtlpExporter();
    });

// 3. Configure standard .NET logging to export to OpenTelemetry
builder.Logging.ClearProviders();
builder.Logging.AddOpenTelemetry(logging =>
{
    logging.SetResourceBuilder(codetoclarityResource);
    logging.IncludeScopes = true;
    logging.IncludeFormattedMessage = true;
    logging.AddOtlpExporter();
});

var app = builder.Build();

app.MapGet("/api/hello", (ILogger<Program> logger) =>
{
    logger.LogInformation("Processing a hello request for a CodeToClarity reader.");
    return Results.Ok("Hello, Observability!");
});

app.Run();
This configuration might look a bit intimidating at first glance. Let us walk through it step by step to demystify the setup process.
First, we create a ResourceBuilder. In the world of OpenTelemetry, a "resource" represents the physical or logical entity that is producing the telemetry data. By setting the service name to CodeToClarity.ObservabilityDemo, we guarantee that all logs, metrics, and traces sent to Grafana will be permanently tagged with this exact name. This tagging becomes absolutely crucial when you operate dozens of microservices and need to filter your dashboard data for one specific application out of many.
Next, we call AddOpenTelemetry() and configure both our tracing and metrics pipelines. Inside the WithTracing block, we add our ASP.NET Core and HttpClient instrumentation modules. We also call AddOtlpExporter(). This single line of code tells OpenTelemetry to prepare the traced data and send it out over the network using the standardized OpenTelemetry Protocol (OTLP).
Finally, we configure the standard .NET logging provider. We clear the default console logging providers and add the OpenTelemetry logging provider instead. By setting IncludeScopes and IncludeFormattedMessage to true, we ensure that our log messages retain their structured data format when they eventually reach Grafana.
Instrumenting Databases and Caches
Tracking incoming HTTP requests is an excellent starting point. However, performance bottlenecks rarely happen in the web routing layer. They almost always happen when your application talks to a database, a third-party API, or an external cache.
The true beauty of the OpenTelemetry ecosystem is the vast community support. The community has built automatic instrumentation libraries for almost every popular technology stack available today.
If you are using Entity Framework Core to communicate with a SQL Server or PostgreSQL database, you can track those database queries automatically. You would simply install the OpenTelemetry.Instrumentation.EntityFrameworkCore package via NuGet. Then, you would add .AddEntityFrameworkCoreInstrumentation() to your tracing configuration block in your code.
If you are using Redis for distributed caching, you would install OpenTelemetry.Instrumentation.StackExchangeRedis and append .AddRedisInstrumentation().
By doing this, your distributed traces will instantly become significantly richer. A single trace visual will display the initial HTTP request, the exact number of milliseconds spent executing the Entity Framework Core database query, the time spent fetching cached data from Redis, and the final response delivery time. You will never have to guess why an API endpoint is slow again. The visual timeline will point you directly to the slow database query.
Connecting Your Application to Grafana Cloud
Our application is now fully instrumented and attempting to export data via the OTLP protocol. However, it currently does not know where to send that data. By default, the OTLP exporter attempts to send data to a local collector at localhost:4317. Since we are utilizing Grafana Cloud for our backend, we need to point the exporter to the correct cloud endpoint and provide secure authentication credentials.
If you do not already have a Grafana Cloud account, navigate to their website and register for a free tier account. Once you are logged into your Grafana Cloud portal, find the OTLP configuration section in the integrations menu.
You will need to gather three specific pieces of information from the Grafana Cloud portal:
- OTLP Endpoint: The public URL where your application will transmit the telemetry data. It usually looks something like
https://otlp-gateway-prod-eu-west-2.grafana.net/otlp. - Instance ID: Your unique numerical Grafana instance identifier.
- API Token: A secure, generated password that grants your application permission to push data into your specific instance.
For standard security reasons, you should never hardcode these credentials directly into your C# source files. Instead, we will leverage the standard .NET configuration system. Open your appsettings.json file and add the following configuration block at the root level:
{
  "Logging": {
    "LogLevel": {
      "Default": "Information",
      "Microsoft.AspNetCore": "Warning"
    }
  },
  "AllowedHosts": "*",
  "OTEL_EXPORTER_OTLP_ENDPOINT": "https://otlp-gateway-prod-eu-west-2.grafana.net/otlp",
  "OTEL_EXPORTER_OTLP_PROTOCOL": "http/protobuf",
  "OTEL_EXPORTER_OTLP_HEADERS": "Authorization=Basic <YOUR_BASE64_ENCODED_TOKEN>"
}
The OpenTelemetry SDK is designed to automatically read environment variables and configuration settings that are prefixed with OTEL_. By defining these keys in our appsettings.json file, the AddOtlpExporter() method we invoked earlier will automatically detect them and configure the secure network connection.
Pay special attention to the OTEL_EXPORTER_OTLP_HEADERS value. Grafana Cloud requires standard Basic Authentication for incoming OTLP data. You will need to take your Instance ID and your API Token, combine them into a single string formatted as InstanceID:ApiToken, and encode that entire string as Base64. The resulting Base64 string will replace the <YOUR_BASE64_ENCODED_TOKEN> placeholder in your configuration file.
The Magic of Log Correlation
Run your application locally and hit the /api/hello endpoint a few times using your browser or a tool like Postman. Your application is now generating traces, metrics, and logs, and shipping them seamlessly to Grafana Cloud.
Log into your Grafana dashboard and navigate to the Explore view. Select your tracing data source from the dropdown menu. You should immediately see the traces generated by your recent API requests.
When you click on a specific trace, you will see a detailed waterfall chart. This chart breaks down exactly how long the request took at every stage. If you had executed database calls or outbound HTTP requests, they would appear clearly as child spans underneath the main incoming request span.
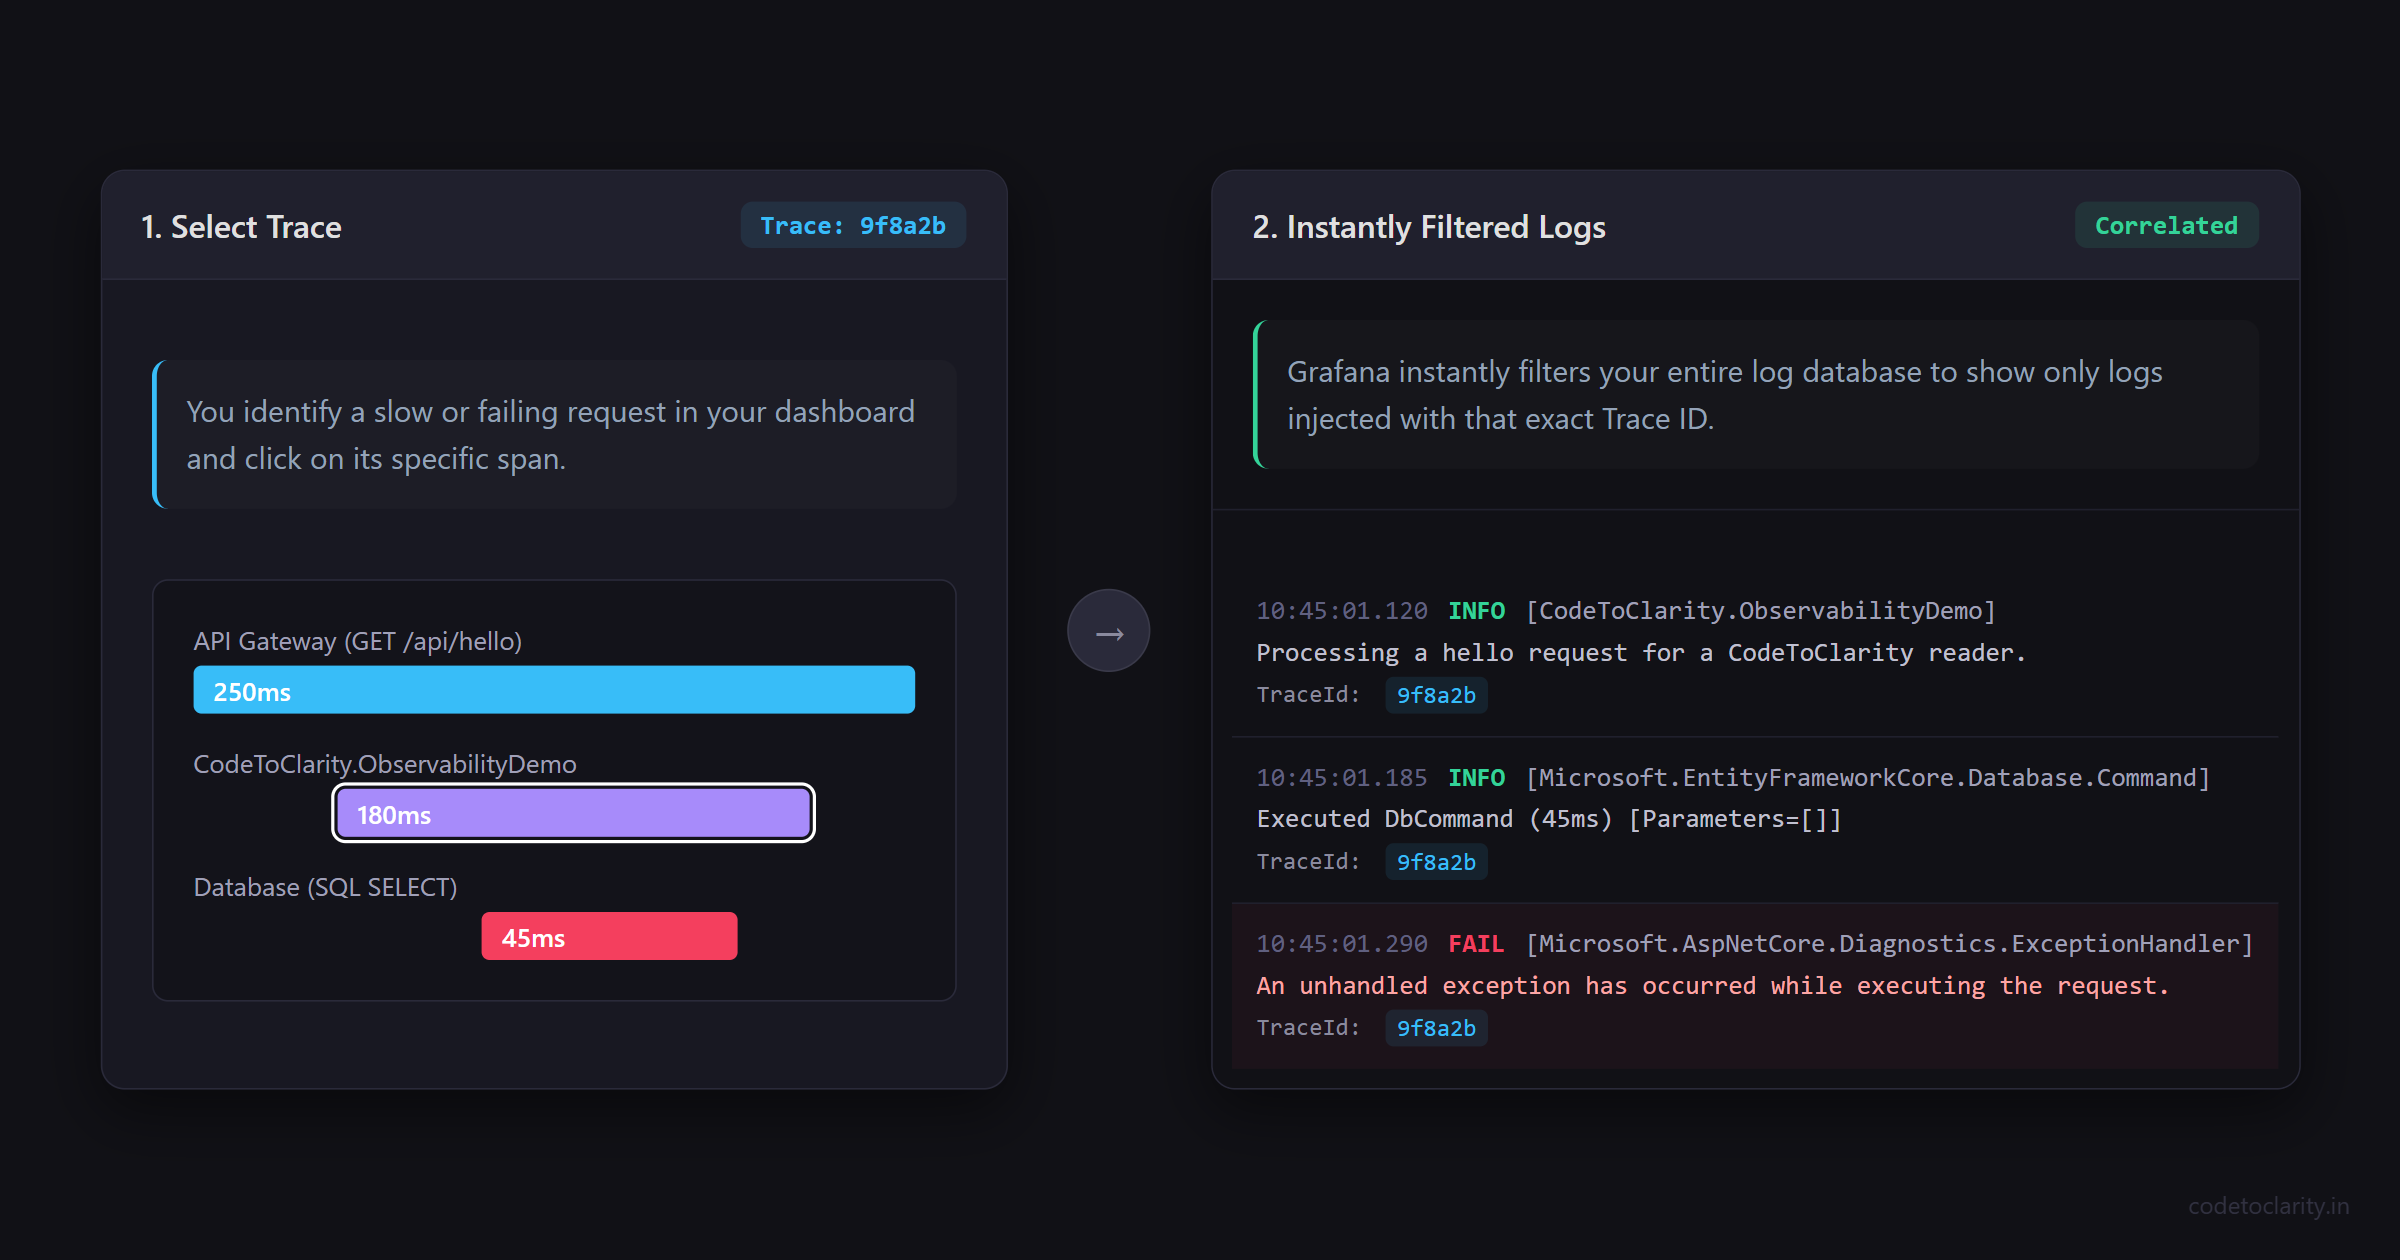
This visualization is powerful on its own. But here is the truly game-changing feature of this entire setup: Log Correlation.
In traditional monitoring setups, if you locate a slow request in your performance tracking tool, you have to manually copy the timestamp. Then, you open a completely different logging tool, paste the timestamp, and try to guess which log entries belong to that specific failing request. It is a highly tedious and notoriously error-prone process.
Because we configured our standard .NET logging pipeline to use the OpenTelemetry provider, every single log entry generated during an HTTP request is automatically injected with the current active Trace ID.
When you view a trace in the Grafana interface, there is a dedicated button allowing you to view the associated logs. Clicking this button instantly filters your entire massive log database to show only the specific log entries that occurred during that exact request. You can see the request start event, the specific LogInformation message we wrote in our endpoint code, and the request completion event. All of these logs will be perfectly aligned with the visual trace timeline.
This capability is widely considered the holy grail of production debugging. You can identify a failing request via a high-level metric alert, drill down into the visual trace to see which specific internal service call failed, and instantly pull up the exact exception log associated with that failure. You accomplish all of this without ever leaving the unified Grafana interface.
Common Observability Pitfalls for Beginners
As you begin your journey into OpenTelemetry and Grafana, there are a few common traps you should avoid. The most frequent mistake beginners make is logging too much unnecessary data. Remember that telemetry data costs money to store and process over time. If you log every single variable state in a massive loop, you will overwhelm your Grafana Cloud limits very quickly. Instead, focus on logging meaningful state changes and critical business errors.
Another common pitfall is ignoring the security of your OTLP endpoint. We used a configuration file to store our endpoint and token in this guide for simplicity and learning purposes. In a real production environment, you should never store API tokens in plain text JSON files. You should utilize secure configuration providers like Azure Key Vault, AWS Secrets Manager, or local user secrets during development to keep your Grafana credentials safe from source control exposure.
Finally, developers often forget to instrument their background tasks. Incoming HTTP requests are handled automatically by the ASP.NET Core instrumentation package. However, if you have a background worker processing messages from a message queue, you must manually create a new activity span for that specific work. If you neglect your background tasks, your traces will end abruptly at the queue, and you will lose visibility into the asynchronous parts of your system.
Scaling Observability in Distributed Systems
The configuration we have built today is perfect for monitoring a single web API. However, the real architectural power of OpenTelemetry shines brightest when you move into distributed systems and microservice architectures.
Imagine you are building an e-commerce platform. You have a frontend Checkout API, a backend Inventory gRPC service, and a background Shipping worker process that reads messages from a RabbitMQ queue.
If you add the exact same OpenTelemetry NuGet packages and configuration boilerplate to all three of these applications, OpenTelemetry handles the complex distributed tracing automatically. When the Checkout API makes a network call to the Inventory service, OpenTelemetry automatically injects the Trace ID into the outgoing HTTP headers. The receiving Inventory service reads that header and seamlessly attaches its own internal spans to the exact same trace.
When you look at Grafana later, you will see a single, unified trace that starts at the Checkout API, crosses the network boundary into the Inventory service, and eventually ends up processing in the Shipping worker. You gain a complete, end-to-end view of your entire complex business transaction.
This vendor-neutral architectural approach means your engineering team is never locked in. If you decide to move away from Grafana Cloud in the future and choose to self-host a tool like Jaeger or purchase a different commercial vendor solution, you simply update the OTLP endpoint URL in your appsettings.json file. You do not have to touch a single line of your actual C# application code.
Conclusion
Implementing proper observability is no longer an optional luxury reserved only for massive enterprise engineering teams. It is a fundamental technical requirement for building reliable, maintainable software today. By combining the standardized, vendor-neutral instrumentation of OpenTelemetry with the powerful visualization capabilities of Grafana, you gain complete visibility into your .NET applications.
You have successfully moved your team from guessing what went wrong to knowing exactly what happened. You have permanently eliminated the tedious process of hunting through unorganized text files. Most importantly, you have established a solid technical foundation that will scale effortlessly as your application grows in complexity and user volume.
The next time your phone buzzes on a Friday evening with a critical production issue, you will not panic. You will simply open your Grafana dashboard, follow the visual trace, find the automatically correlated log entry, and fix the underlying problem with confidence. That is the true power of observability.

Kishan Kumar
Software Engineer / Tech Blogger
A passionate software engineer with experience in building scalable web applications and sharing knowledge through technical writing. Dedicated to continuous learning and community contribution.